Ultrafast Imaging of Plasmon-Mediated Demagnetization Dynamics
In a groundbreaking study, researchers at KTH employed Lorentz ultrafast electron microscopy (LUEM) to observe the spatiotemporal dynamics of ultrafast demagnetization mediated by surface plasmon polaritons (SPPs) in a permalloy thin film. By combining transient optical gratings (TG) with LUEM, they revealed how propagating SPPs modulate the spatial and temporal evolution of demagnetization at nanoscale precision and sub-picosecond timescales.
SPPs, as collective oscillations of surface charges, enable light concentration into nanoscale volumes, offering a pathway for localized control of magnetic materials. In this study, the researchers identified a clear correlation between SPP intensity and the demagnetization amplitude, highlighting the role of SPPs in enhancing and spatially modulating the optical excitation of magnetization. Additionally, a beat-like magnetic periodicity was observed, resulting from the interaction between propagating SPPs and optical pump waves, further demonstrating the intricate interplay between light, plasmonic waves, and magnetic states.
Through numerical simulations and experimental validation, the team showed how plasmonic hotspots influence the efficiency and spatial distribution of ultrafast demagnetization. These insights pave the way for innovative approaches to control magnetization dynamics in applications ranging from high-speed magnetic storage to ultrafast spintronics.
This work has been performed by PhD student Yuzhu Fan and Researcher Gaolong Cao. The project is supervised by Prof. Jonas Weissenrieder.

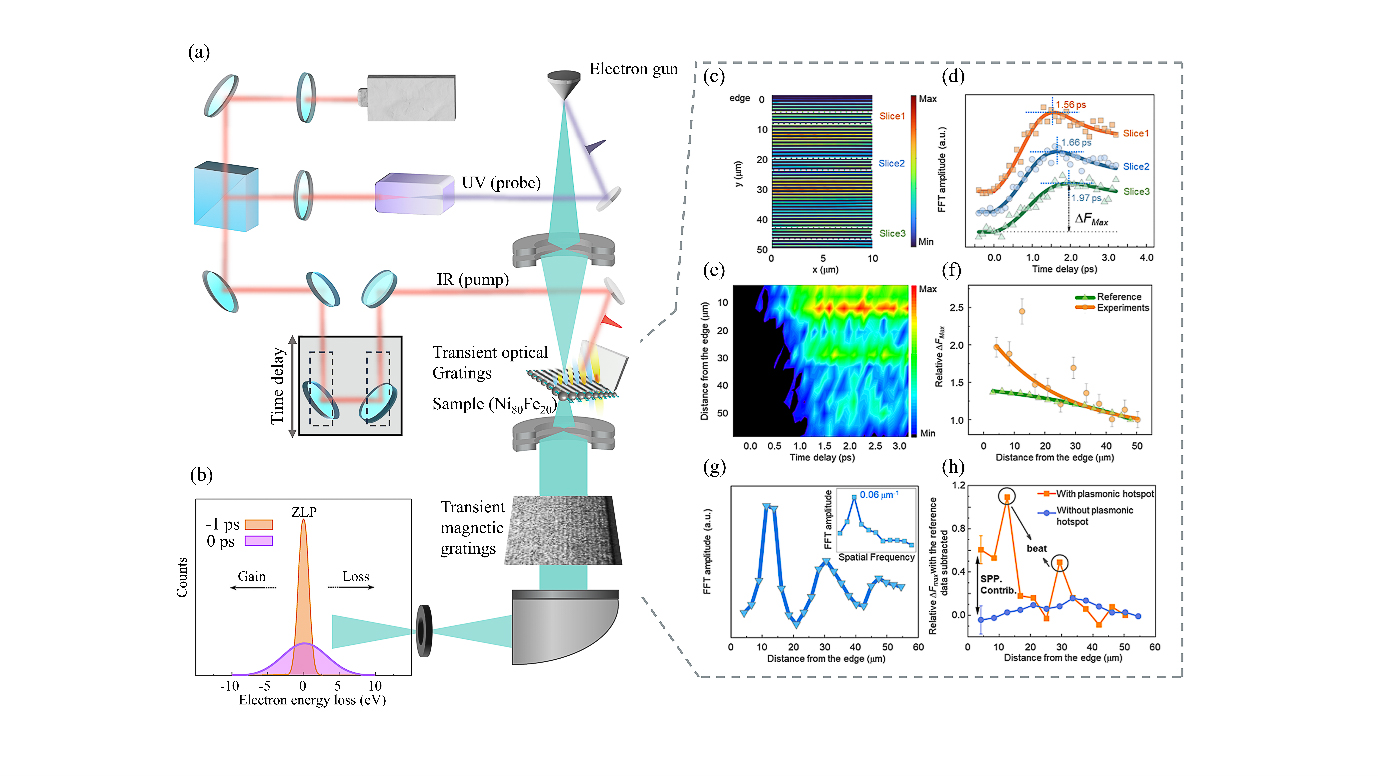
Observation of the interaction between SPPs and ultrafast demagnetization by LUEM.(a) The LUEM at KTH. (b) Fitted photo-induced nearfield electron microscopy spectra before time zero (electrons have no interaction with SPP) and at time zero (electrons interact with SPP) with IR pump. (c) A typical LUEM image at a time delay of 2.9 ps. (d) Selected demagnetization time traces from slices with the same color code as in (c). The traces are offset for clarity. (e) Experimental space-time contour of the FFT amplitude as a function of distance from the edge. (f) Experimental (orange) and simulated reference (green) relative DFmax as a function of distance from the edge, where DFmax is maximum demagnetization amplitude. Solid lines are fitted by exponential functions. The reference data refers to simulated distribution of relative ΔFmax dominated by TG. (g) Averaged FFT amplitude over 1-3 ps time delay as a function of distance from the edge. The inset shows the spatial frequency of the ‘magnetic’ beat in (e) after FFT processing. (h) The spatial distribution of the ΔFmax with plasmonic hotspot (orange data) and without plasmonic hotspot (purple data). To isolate the contribution of SPP to the demagnetization, we subtracted the simulated reference data for the analysis of both demagnetization results.
