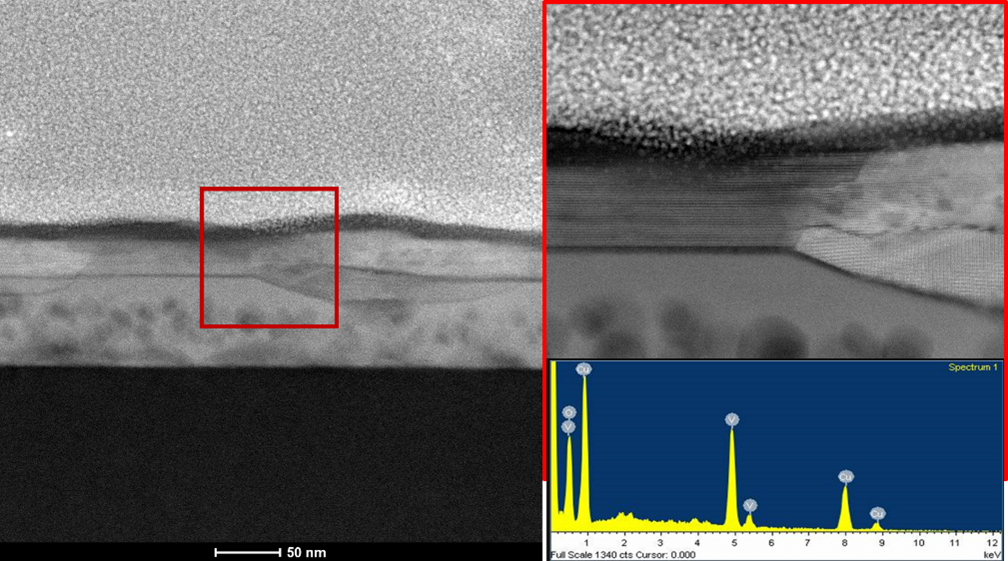
STEM image of vanadium oxide film cross-section and corresponding EDX spectrum
Case study: mapping oxidation states of vanadium oxide
In this case study we show how electron energy-loss spectroscopy can be used to map chemical state in the sample.
We have investigated vanadium oxide (VxOy) film deposited busing pulsed DC reactive magnetron sputtering on mica substrate. The scanning TEM (STEM) images revealed a layered structure of the film indicating possible differences in chemical composition. Due to the strong overlap between V and O peaks in EDX spectrum elemental ratio by EDX peak quantification.
However, the near edge fine structure of the EELS spectrum allows to distinguish between different oxidation states of vanadium. The EELS fine structures can be distinguished by the presence of the kink in VO2 spectrum (marked with red arrow), the shapes of oxygen O-K(P) and O-K(Q) peaks and their ratio to vanadium L2,3 peaks.
We obtained the spectrum image and calculated the vanadium oxidation state map by fitting spectrum derivative as a linear combination of reference spectra derivatives. The result revealed that the bottom layer closest to substrate is VO2, and top layers consist of V2O5 and mixed VO2 + V2O5 phase.

(a) HAADF-STEM image of three-layer vanadium oxide thin film. (b,c) EELS spectra (green area) obtained from points 1 and 2 marked in image (a) plotted together with reference VO2 and V2O5 spectra (red and blue lines, respectively). (d) HAADF-STEM image of three-layer vanadium oxide thin film with corresponding map of vanadium oxidation state (see details in text).
